Why do I need Data Chart?

Visually Appealing
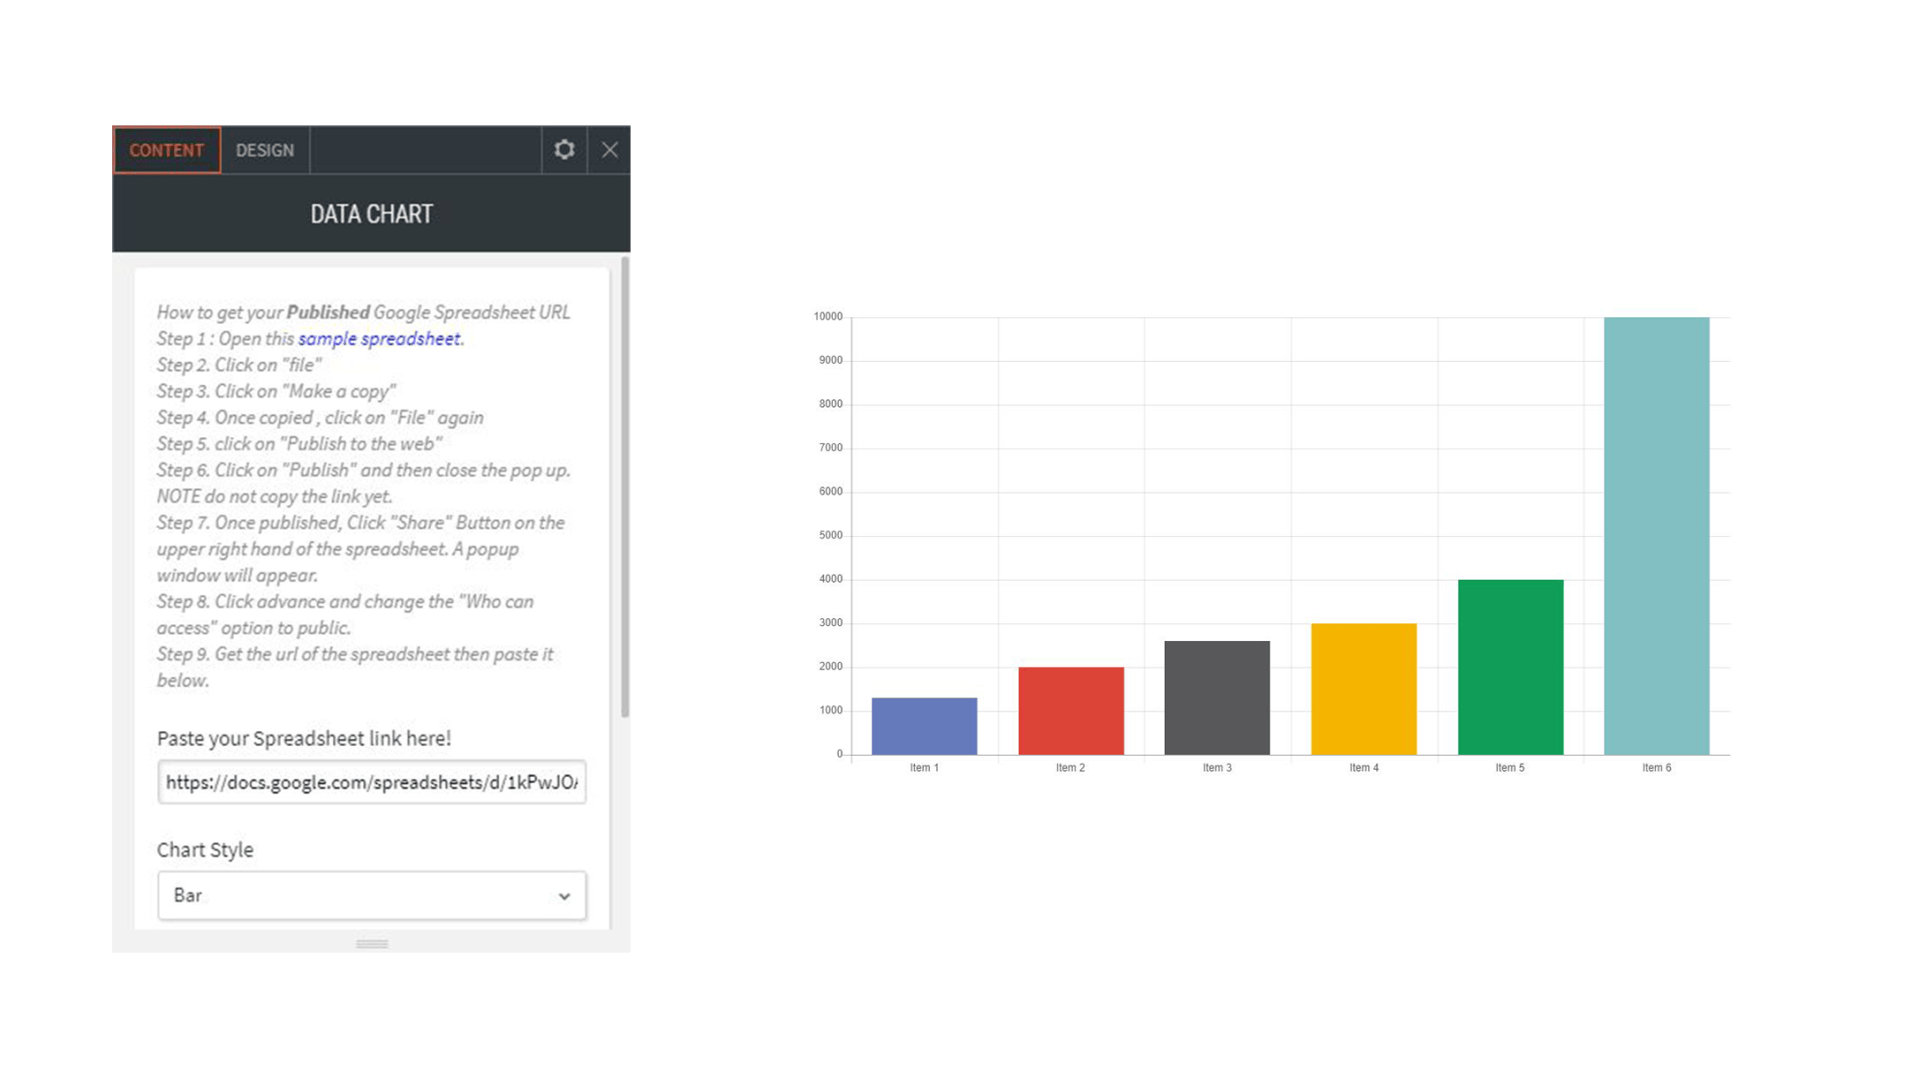
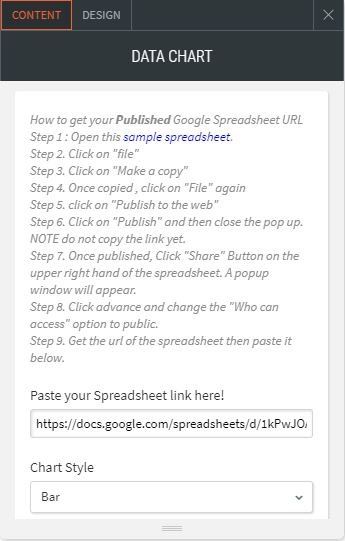
Make your data easier to understand with unique and visually appealing graphic representations.

Responsive
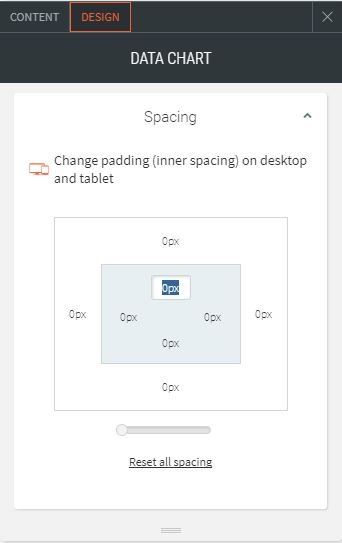
Improve user experience and increase engagement with this fully responsive Data Chart widget.

Customizable
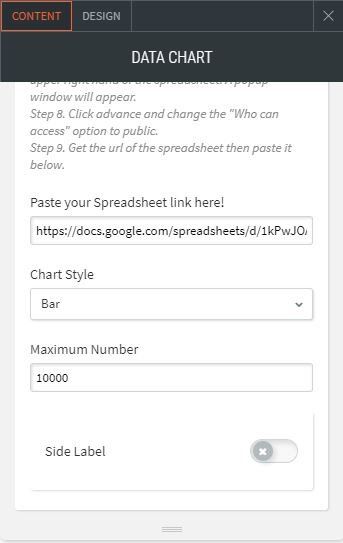
Choose beetween column, line, and pie charts. Add layout and primary colors of your choice. Create a chart that matches your data type.
What makes Data Chart special?